RTW Monitor Summary - Part Two

In the second of this four part series we examine return to work outcomes by jurisdictions i.e. the states and authorities.
We present visual information with simple descriptions to enable you to assess:
- Durable RTW rates - a Durable RTW is achieved when a person is back at paid work at approximately six months post claim lodgement.
- All RTW rates - the proportion of people who returned to any kind of work at any stage between lodging a claim and the interview, people who have returned to work but then dropped out are included.
- The average duration of time injured workers have been back at work when interviewed at six months, in durable RTW cases.
Despite the importance of return to work, we discovered that reviewing state and system outcomes using the Monitor Report data is not made simple. To do so we had to take the jurisdictional information from the last four RTW Monitor Reports, insert it into Excel, and then look at state and system based trends.
We put on record a plea here for more information to be provided in future editions of the Monitor.
We note that in addition to the overview edition published by the Heads of Workers' Compensation Authorities the Monitor is also published in a separate edition for each of the jurisdictions and summarises their individual performance. Unfortunately only Tasmania has chosen to make their edition publicly available. We commend Workplace Standards Tasmania for their transparency and invite other states and authorities to follow suit.
The results of our comparative analysis show that durable and non durable RTW outcomes are getting worse in most jurisdictions.
In a recession it is generally accepted that claim numbers go down, but duration of time off work goes up. However the influence of the financial downturn does not explain the decline in RTW outcomes. The decline in RTW rates evident in the graphs below began three years ago when the economy was booming.
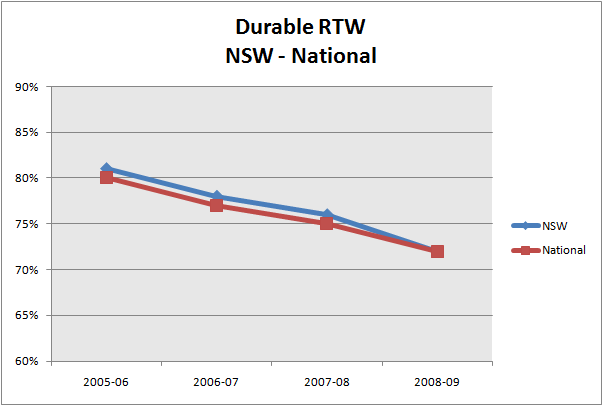
Durable RTW
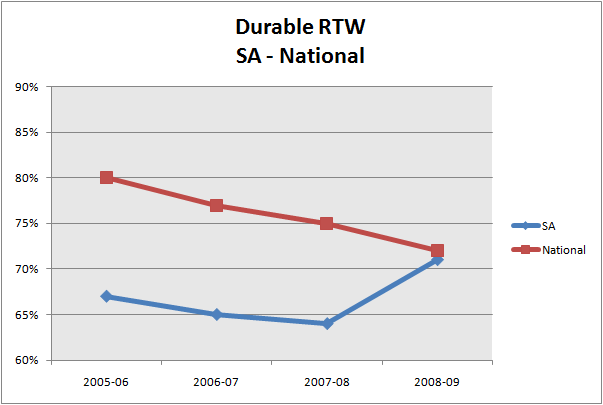
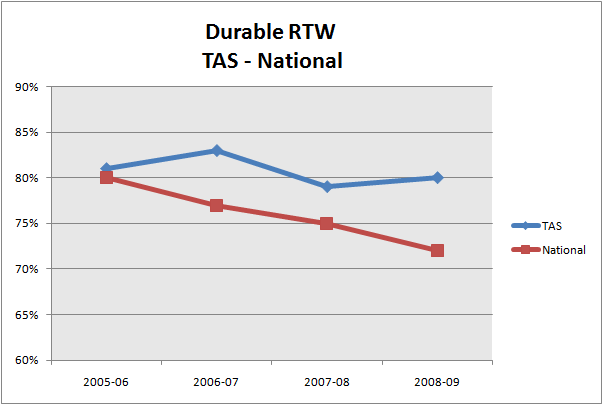
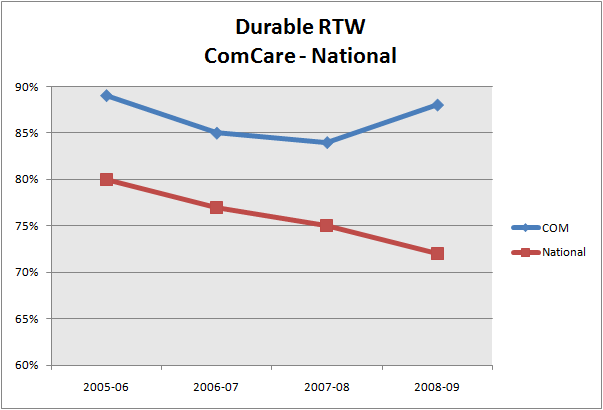
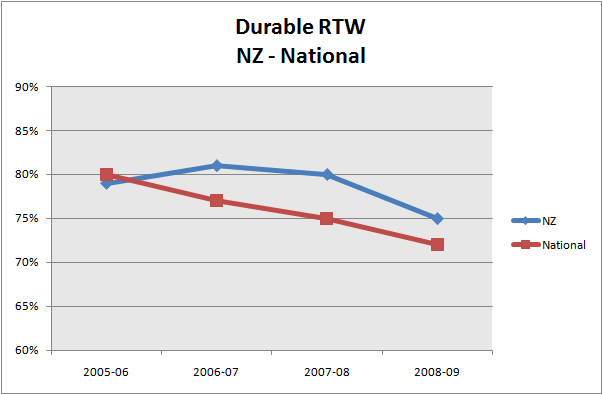
Durable RTW rates represent the proportion of injured workers who returned to paid work and were still working seven to nine months after their claim was lodged.
Durable RTW rates in NSW have declined steadily over the last three years, in line with the national rates. Durable RTW rates have fallen from 82% to 77%.
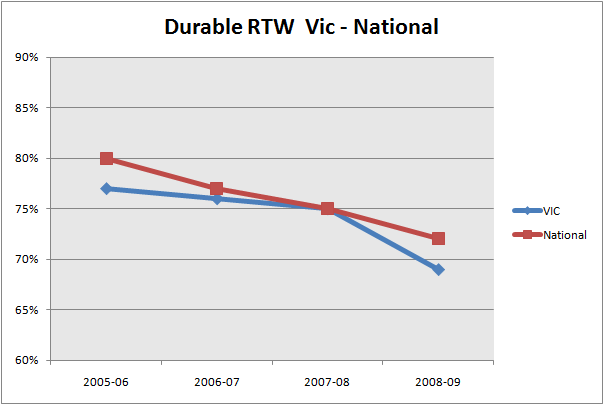
Victorian Durable RTW rates have gone from 77% to 69%, with a six percent fall in the last year.
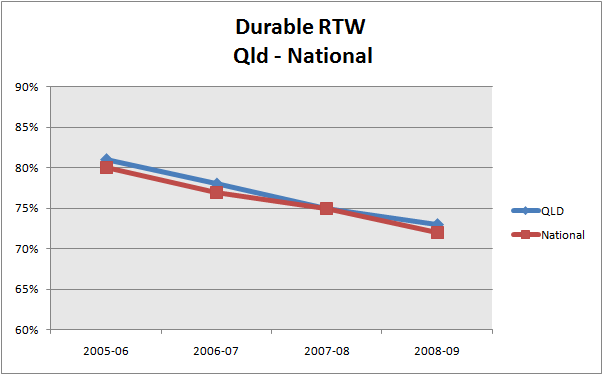
Durable Return to work has declined steadily in Queensland, mirroring the national average.
South Australia is making a return from 'basket case' to kiss the national average.
Tassie continues to perform above the national average. If the financial climate is claimed to have impacted claim durations and negatively impacted Durable RTW rates in other jurisdictions why has Tasmania not suffered the same problem?
Comcare has consistently high Durable RTW rates. Have their rates remained high due to a lack of retrenchments in Comcare employers?
NZ Durable Return To Work rates have fallen in the last 12 months. Prior to that NZ has performed better than the other jurisdictions.
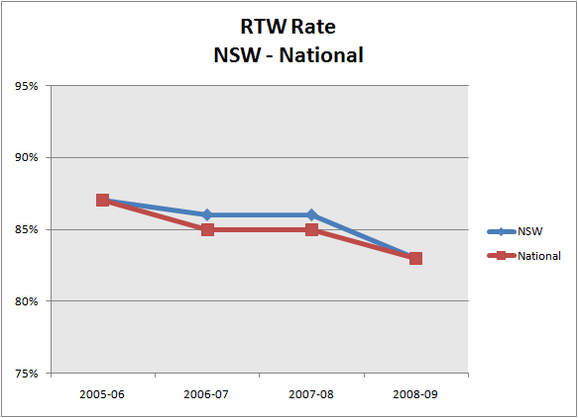
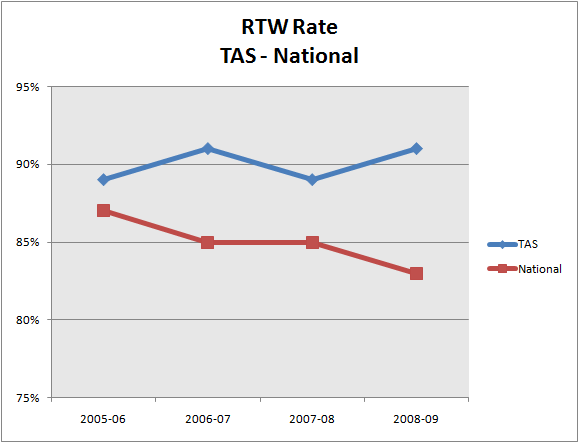
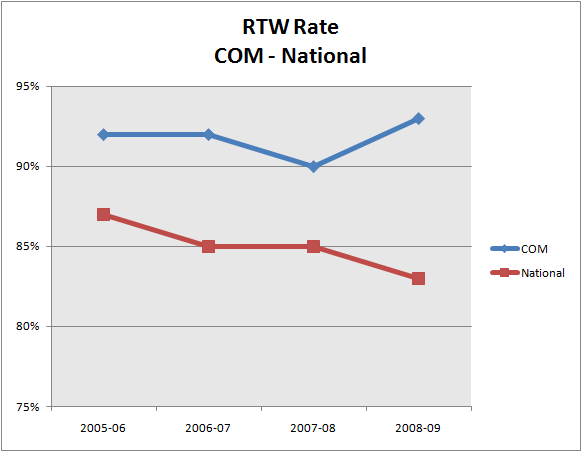
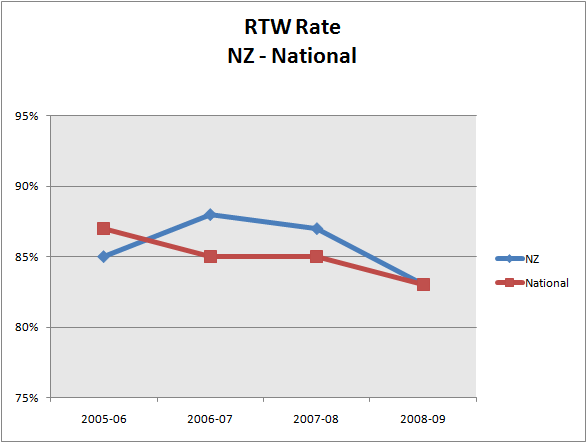
The Return To Work rate
The RTW rate represents the proportion of all workers who had returned to work at any time between the time they lodged an injury claim and the time of the interview. It includes those who remained at work and were still in work at the time of the interview (durable RTW) and those who had been back at work and then went off work.
The RTW rate can be seen as a measure of the effectiveness of return to work policies and programs.
The RTW rate has reduced in NSW and is now sitting on the national average.
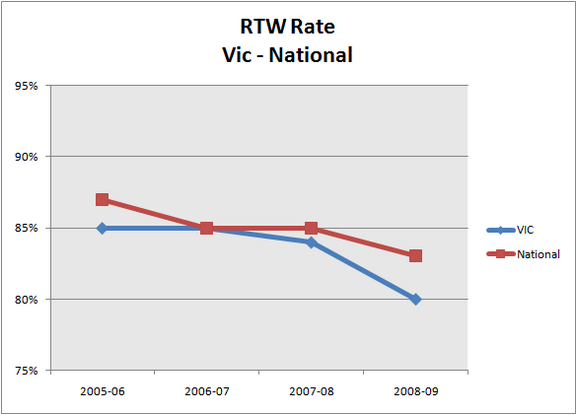
The rate of RTW in Victoria has dropped from 85 to 80% over the last two years.
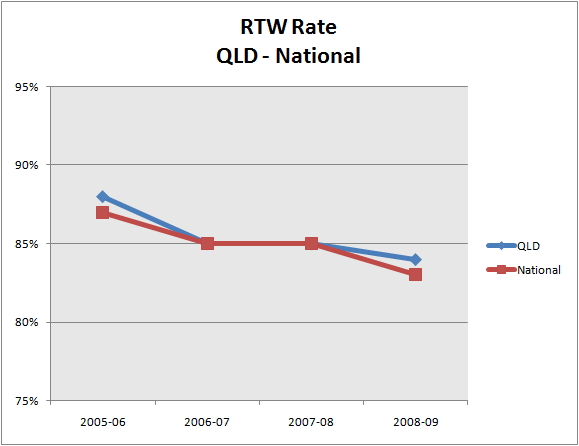
RTW rates have declined from 88% to 84% over the last three years.
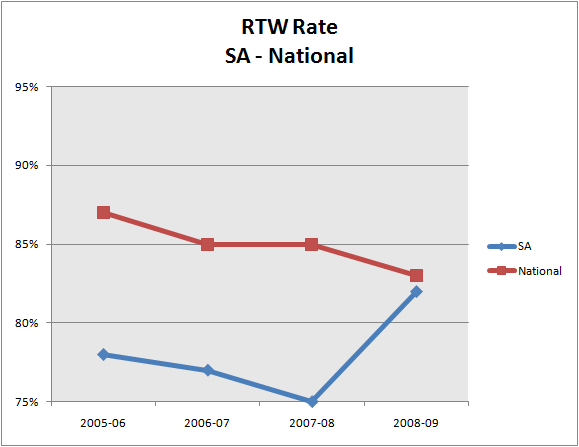
The changes in legislation in SA are associated with a dramatic jump in RTW in the last 12 months.
Tasmania continues to punch above the national average, and defies the national drop in RTW rates.
Comcare continues to perform above the national average and is improving.
New Zealand's previously high rates of RTW are dropping.
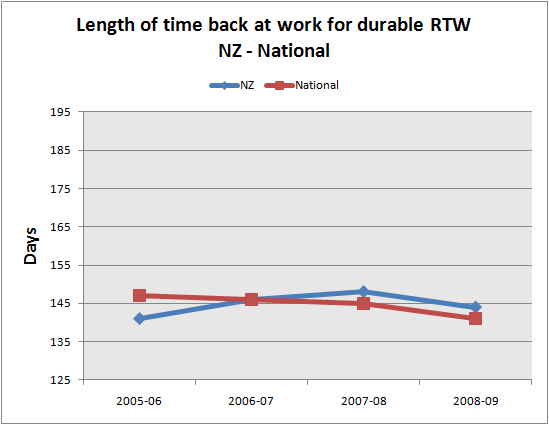
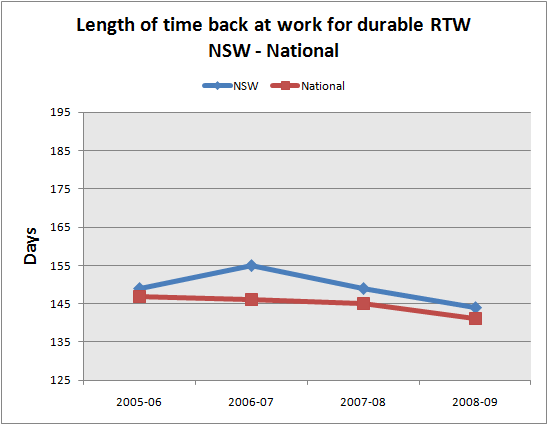
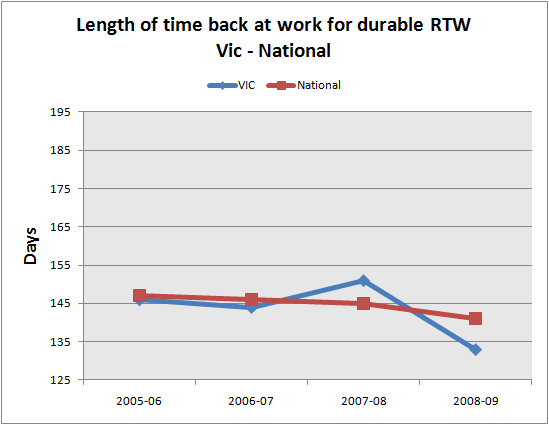
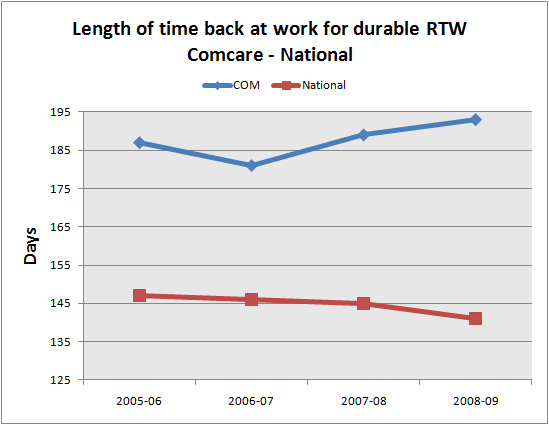
Length of time back at work for durable RTW
The average length of time injured workers had been back at work at the time of interview measures how long it is taking for effective return to work.
In successful RTW cases the injured worker is at work at the time of interview (just over six months after their claim). The longer the length of time back at work the earlier the return to work has occurred.
The duration of time back at work has been dropping nationally over the last two years. NSW is roughly tracking the national average.
Victoria improved results last year, but in 2008-09 the average time the person had been back at a durable RTW program had decreased by 13 days. This means the average amount of time off went up by about two and a half weeks (in durable return to work cases).
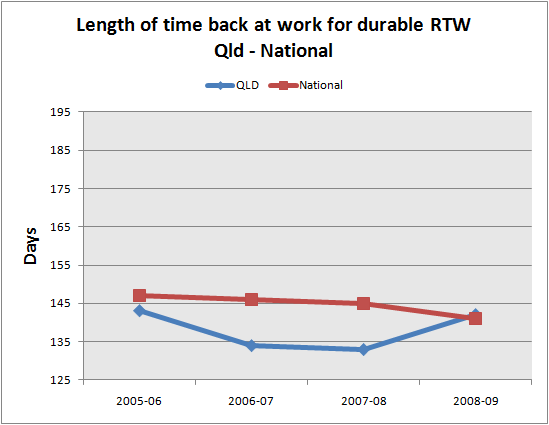
Queensland improved its performance and is now at the national average.
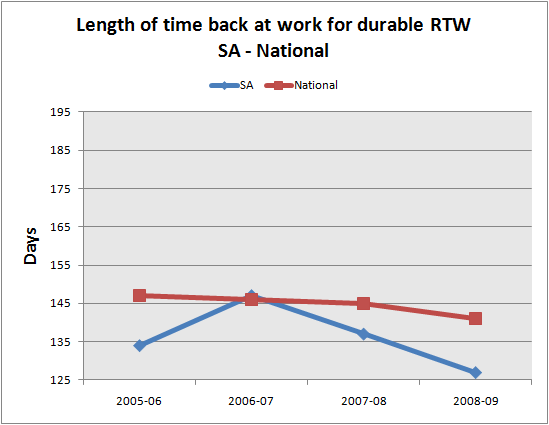
While return to work rates are up in South Australia, the duration of time to get back to work is going down, and is below the national average.
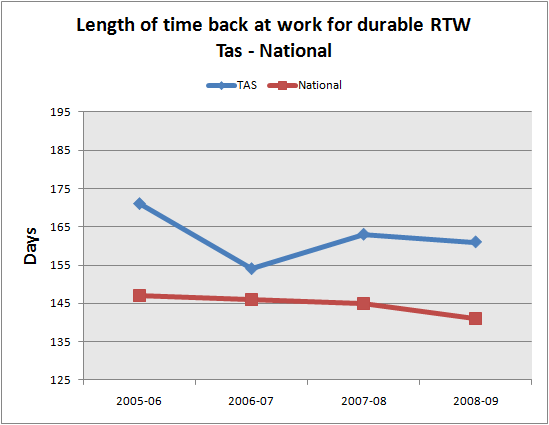
Tasmania consistently scores above the national average, Tasmanians are more likely to return to work, have a durable return to work, and get back to work more quickly.
Return to work in Comcare employers occurs significantly earlier. On average, Comcare employees are back at work close to seven weeks earlier than the national average.
Larger employers, less redundancies, less physically demanding work, and better systems are possible contributors to the earlier return to work in this jurisdiction.
New Zealand outcomes have remained stable over the last three years.