
Durable RTW - was life meant to be this hard?

In this, the last of our four part series on the 2008/09 Return To Work Monitor Report, we look at durable RTW rates and conclude that the visible decline in performance in a number of jurisdictions is matched by an increasing number of their claimants reporting that someone made it hard for them to return to work.
The RTW Monitor interviews employees at about six months after they have lodged a claim. Durable return to work is defined as a person returning to work and still being at work at the time of the phone interview. It is a measure of sustained return to work.
The RTW Monitor data set is not publicly available to analyse, only the Monitors published report.
Ideally one would have the data set available from the Monitor, and run sophisticated statistical tests to get down to the nitty gritty. However, even at the big picture level, there are some obvious influences on durable return to work.
Campbell Research & Consulting, who conduct the Monitor survey, has the opportunity to analyse the data. They point out:
Injured workers who had a durable RTW were more likely to
- Receive a RTW plan
- Be involved in the development of the plan
- Be given help to do what was recommended in the plan
- Find the plan helpful compared to those with a non-durable RTW or no RTW.
They also point out a consistent pattern where claimants who stated at least one person had made it harder to RTW were less likely to have a durable RTW, compared to those who either rated people in the RTW process as helpful or having no effect on their RTW.
The experience of the RTWMatters team agrees with this conclusion.
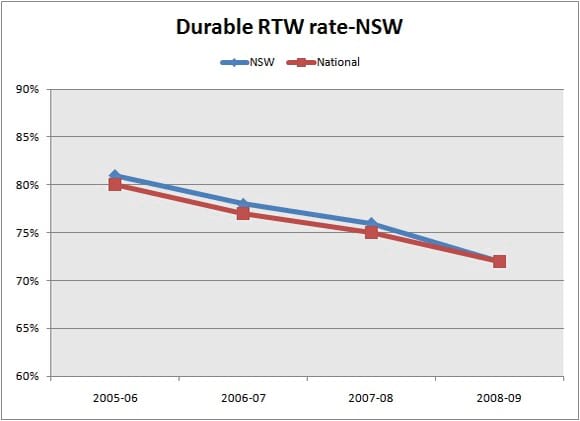
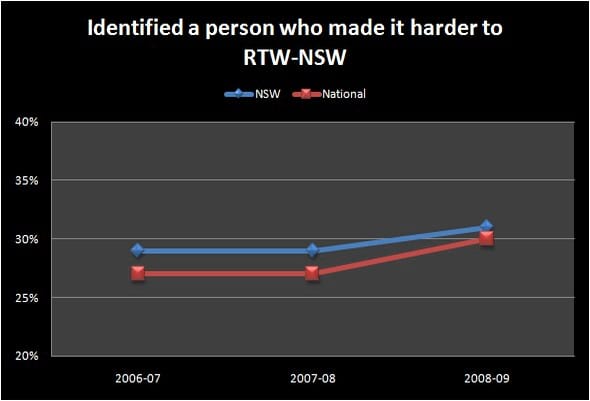
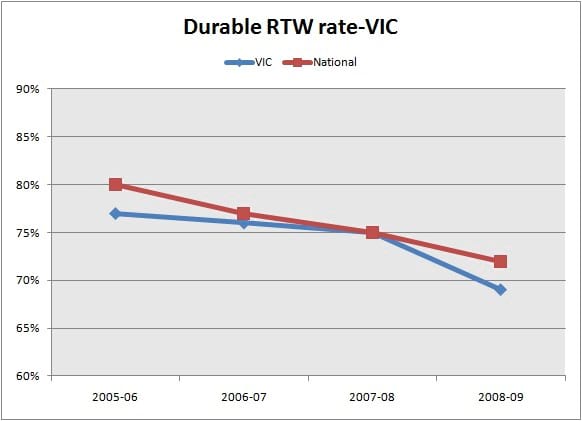
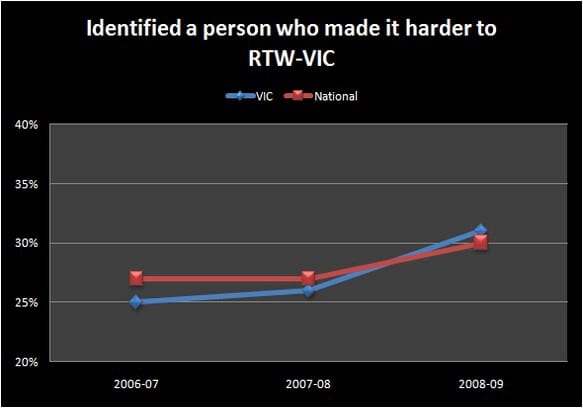
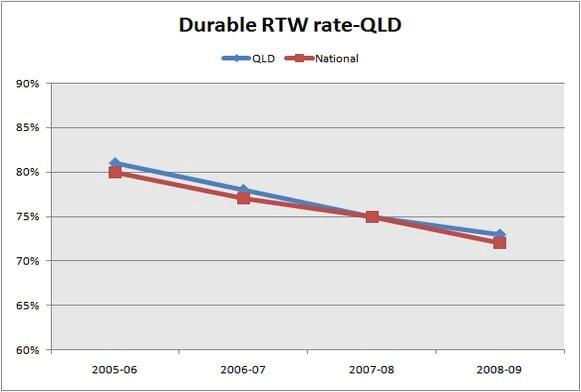
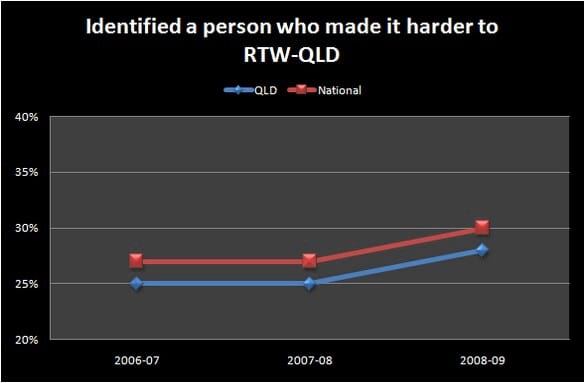
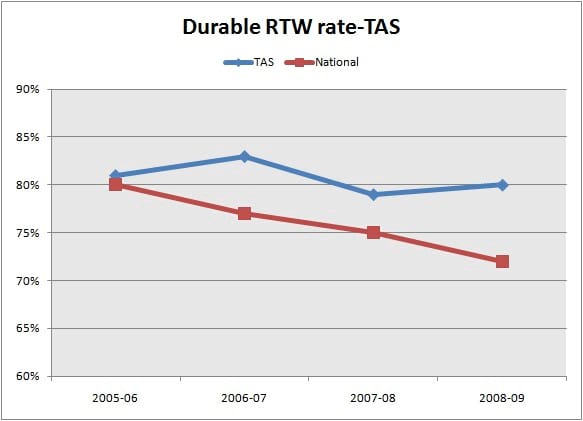
The following graphs show a similar pattern. In NSW, Victoria, and Queensland, durable return to work rates are falling. At the same time, increasing numbers of employees in these states have identified someone who has made their return to work harder. This is most notable in Victoria over the last 12 months.
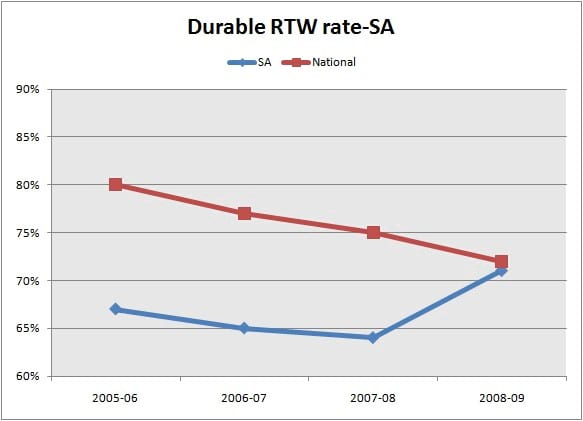
In contrast:
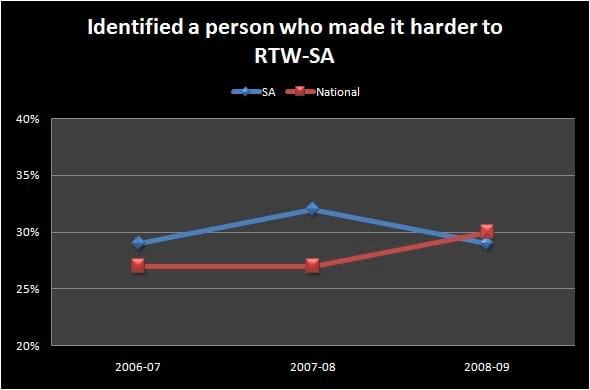
- South Australia durable return to work rates have improved significantly over the last 12 months. In the same 12 month period fewer S.A.employees identified someone as making their return to work harder.
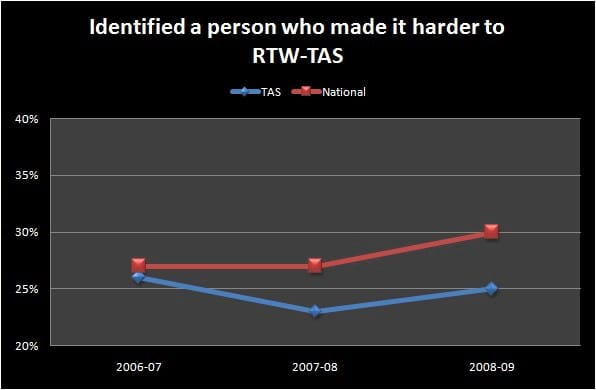
- Tasmanian return to work rates have not materially changed, similarly their rates of identifying someone who made return to work harder have remained the same.
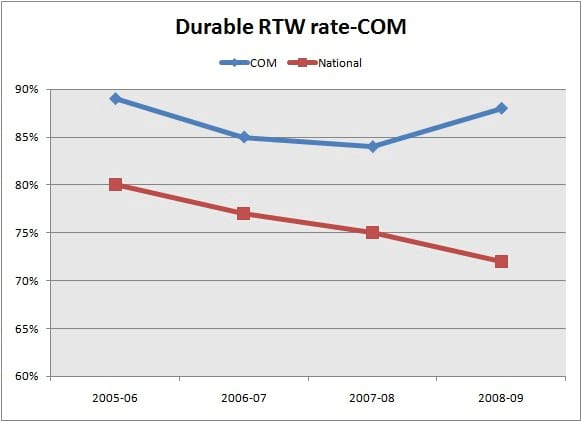
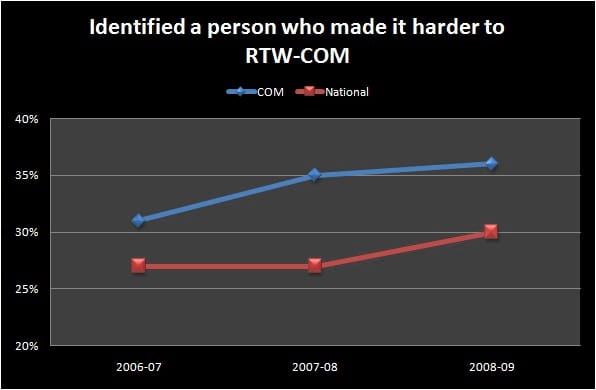
- Comcare is the outlier, it has achieved improved return to work rates, but increasing numbers of their claimants have identified someone who made return to work harder.
In a RTWMatters reader poll some months ago we asked you whether return to work was getting harder to manage. The majority of readers said 'Yes.'
Why is it getting harder? Is frustration with the system negatively impacting on the employee with the injury? Are the demands of employees as enabled by the system becoming too great for employers?
If partnerships underpin return to work, what can be done to enhance rather than frustrate them?
Clearly there is a downward spiral in performance in NSW, Vic and Qld that needs to be addressed quickly and turned around.
 |
 |
 |
 |
 |
 |
Static or improving durable return to work rates
 |
 |
 |
 |
 |
 |