
RTW Monitor 09/10: A change in direction?

Each year the Head of Workers Compensation Authorities publish the RTW Monitor, which provides an year-on-year view of trends in workers comp and return to work. Each Australian jurisdiction is covered, as is New Zealand.
The RTW Monitor has surveyed workers with an injury since the mid '90s, but not all jurisdictions have participated for the full fifteen or so years. Some jurisdictions joined the monitor after it was already up and running; some have come and gone and returned again.
The data that provides the basis for the RTW Monitor is obtained by interviewing claimants around six months after they have lodged a claim. Claimants are questioned about RTW, and about factors that influence RTW outcomes. Thus, the Monitor is a rich source of information that allows us to assess what is happening in RTW in Australia and New Zealand.
We examined the 2008/09 report in detail, analysing RTW results and the factors that influence RTW at the jurisdictional level.
The 2009/10 report was released on August 30. Below, we begin what will be a four-part series looking at RTW trends overall. Subsequent articles will update trends within the states and jurisdictions.
RTW outcomes
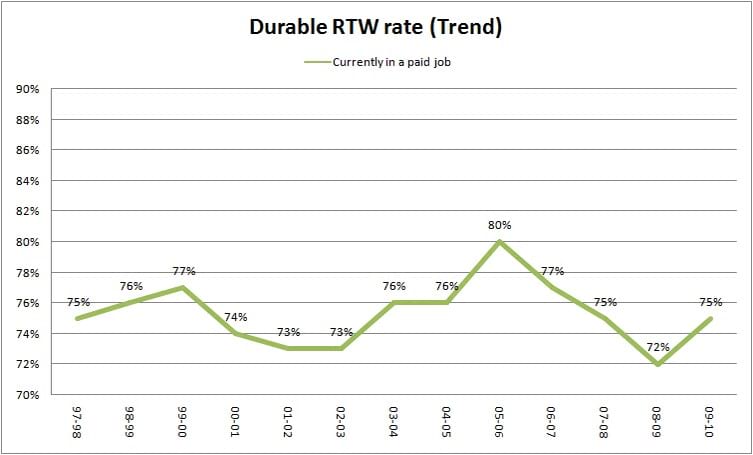
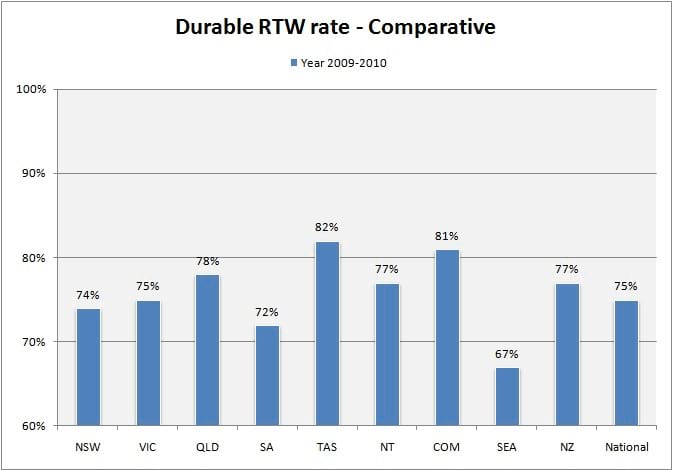
The Durable RTW rate measures whether the employee is back at work at the time of the six month interview. Despite its name, it may still be a temporary RTW (i.e. the worker may stop work some time after the interview). However, a person who has been back at work for six months has a good chance of remaining at work, so this is used as a proxy for durable or sustained RTW.
In 2009/10 we see a reversal of the steady downhill trend in RTW. The durable RTW rate has bounced back to 2008/09 levels.
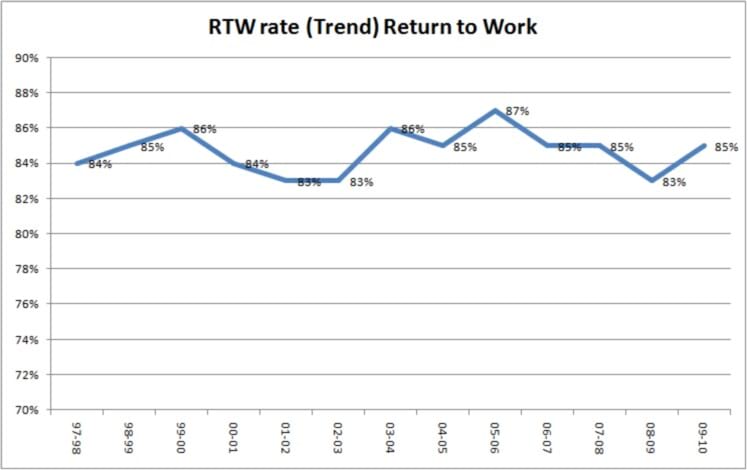
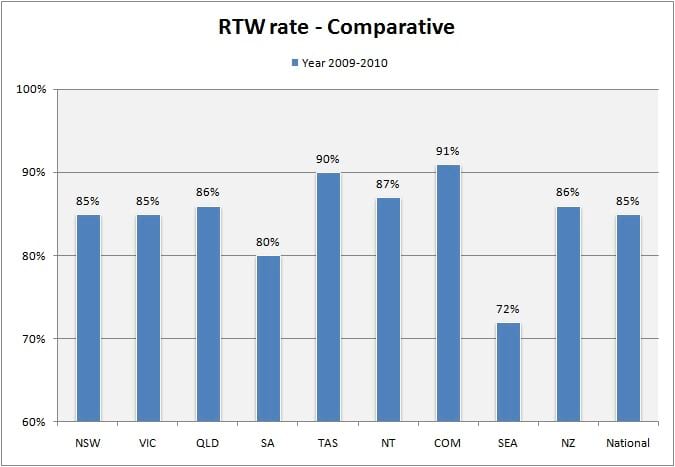
The RTW rate measures whether the person interviewed has gone back to work between the time their claim was lodged and when they were interviewed at around six months post claim. The return to work may have been short term, such as for a few days, or may have been sustained. The RTW rate thus measures ANY return to work.
This year we see a reversal of the steady downhill trend in the RTW rate that occurred between 2005/06 and 2008/09. The rate has bounced back to 85%, as it was two years ago.
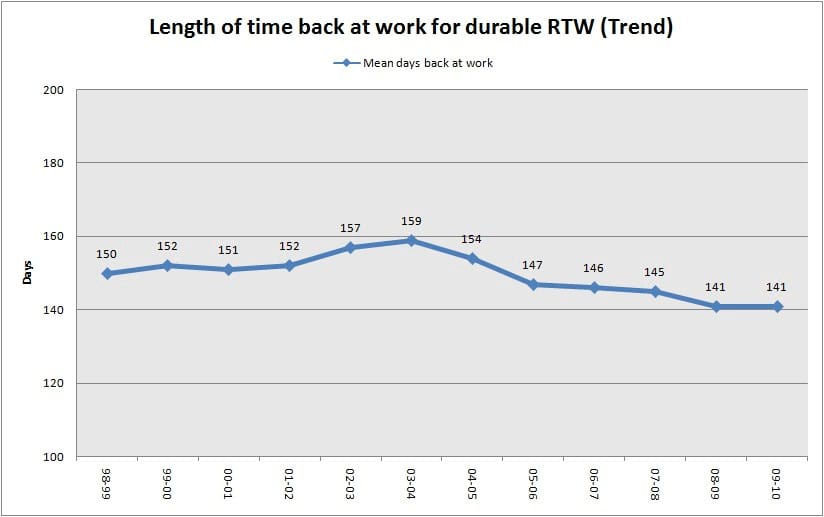
There has been a steady increase in the time it is taking injured workers to return to a durable RTW over the last seven years.
When the person back at work is interviewed at six months post injury, the time they have been back at work is measured. The longer they have been back at work at the time of the interview, the earlier they returned to work.
The duration of time workers have been back at work has been steadily declining between 2003/04 and 2008/09. There has been no change over the last 12 months. Despite a focus on early intervention, return to work is occurring later.
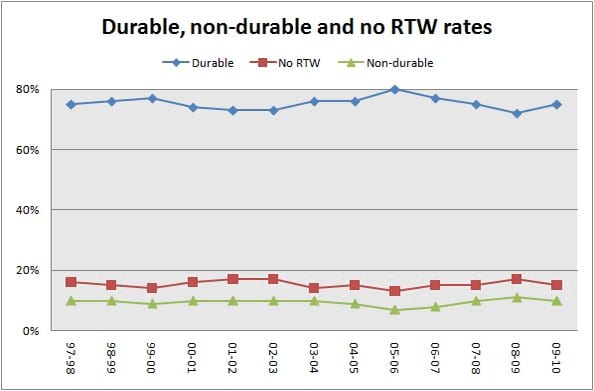
In line with the recent upswing in 'durable RTW' there has been a decrease in 'no RTW' and 'non-durable RTW'.
Reasons for not working
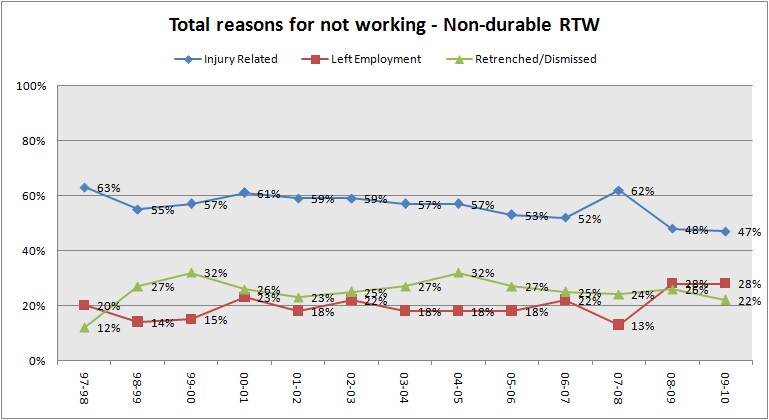
An individual who has returned to work at some point between their claim being lodged and the interview but not at work at the time of the interview has had a "non-durable" RTW.
They are asked why they are not working. The proportion who say this is because of their injury has steadily declined over the life of the Monitor, from around 60% to 47%.
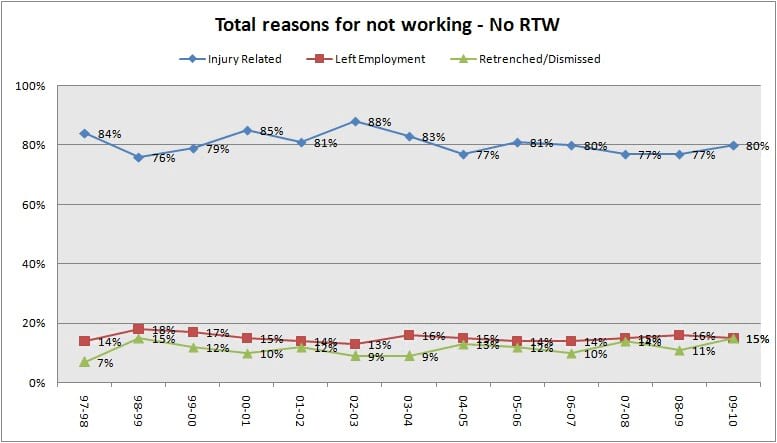
However, for those who have never returned to work since the injury, there has not been a material change in the stated reasons for not working.
Across systems
Comparing RTW rates across jurisdictions is complicated by differences between the systems and the people and kinds of organisations within each system. For example, Comcare is made up of large employers and large employers have significantly higher RTW rates. Availability of modified work, dedicated staff to coordinate RTW, pricing levers in the compensation payments that reward good practice and punish poor practice, and difference in the physical demands of work are examples of factors that improve RTW prospects for Comcare. Conversely, Seacare covers shipping operations, an inherently more dangerous activity than a desk based job.
Comcare has the highest rate of RTW and Seacare the lowest. Of the Australian states, Tasmania has the highest rate of RTW and South Australia the lowest. Much the same pattern is seen in durable RTW rates.
However there are stand out performers. Tasmania has consistently rated highly on RTW rate and Durable RTW rate and this year is no exception. Tasmania has the highest Durable RTW rate across Australasia. What is their magic ingredient?
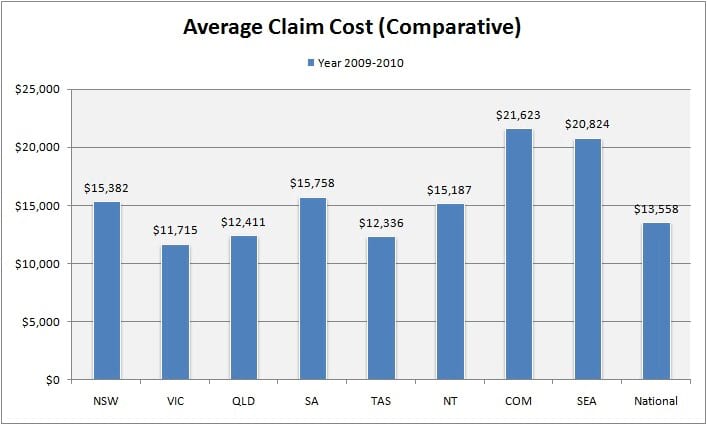
The RTW Monitor is provided with claims data on those interviewed. This information is provided by the relevant authority, not the interviewed person. The RTW Monitor is careful to point out this data should be used with caution, and is information on the demographics of the population interviewed. Nonetheless, this data provides a useful snapshot of further information about the sample population.
As with comparison of RTW, comparison of claims costs needs to be interpreted with caution. Comcare covers employers where wage costs are higher. Victoria has the lowest claim cost of all jurisdictions.
In the next publication we examine the results in more detail by jurisdiction.